


Katie McCurdy has myasthenia gravis, a rare autoimmune condition that she acquired when she was 13. This conditions affects the muscles of the body, but especially those that control eyes and eyelids, facial expression, swallowing and sometimes breathing.
It’s been an ordeal for her, from diagnosis to now when she goes to the doctor and tries to remember everything that has happened since her last appointment. Her description of the experience resonates,
I go into a bland, beige room devoid of any personality. I sit on a paper-covered table and swing my legs….After 10 or 15 minutes, the doctor knocks and comes in the room.
‘So, what brings you here today!?’
At which point I spew forth whatever words and thoughts come to my mind…I usually feel a little rushed…so I end up abbreviating my story… But once I’ve left the office, without fail I realize I forgot to mention a certain symptom, or a certain thought. Sounds inefficient, right?
But Katie is an imaginative and gifted individual who is trained as an interaction designer – someone who simplifies, creates and makes accessible things that are actually quite complex. This work is important in this technological age, allowing everyone access and the ability to navigate computers and mobile devices, for example.
So after years of trying to get effective treatment to control all the symptoms she has, she thought she would visualize her experiences and bring that to a specialist. In November 2011, she provided an image (in her blog) that she created of this graphic visualization. Then she used it at a new doctor appointment.
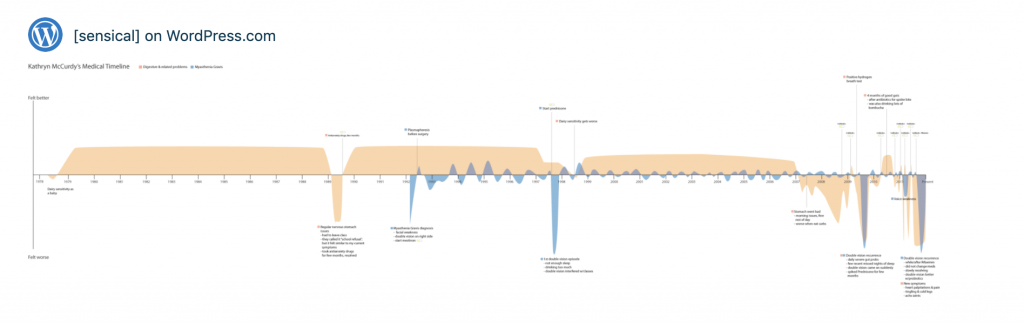
To say the least, it was empowering. She was able to tell her story without forgetting, without rushing, but with authority.
She began using this tool at all her appointments and has refined it, adding some very interesting elements to her visualization. She has shown her work at a number of conferences like HealthDataPalooza and MedX. She has also done what user experience designers do, talk to patients and healthcare providers to get input on what is needed in these designs.
At this point she has a start-up company in Vermont called Pictal. She has a company website and also writes for “The Medium.” She’s helped veterans suffering from PTSD, has done pro bono work and has had a few clients. This past June she wrote about her second year of building a business as a solo entrepreneur. She even made a tiny profit her second year! In that description, Katie listed some needs for her next steps, the first being a team to work with, the second, research evidence that helps explain and support the use of health visualization as an important and effective tool.
Take a look at her website and see what you think. Perhaps you can offer your help or could use her services to visualize your own health experience.
For another view of empowerment through visualizing your health history, take a look at a post from our archives.
Feature Image by Arek Socha from Pixabay
References:
- https://sensical.wordpress.com/2012/01/03/medical-history-timeline-a-tool-for-doctor-visit-storytelling/
- https://medium.com/pictal-health/annual-report-year-2-of-pictal-health-a8de7de13e2