


Deep Breathing Time Again… We’re about to seek the answer to another of the numbers that health and medical professionals use daily from statistics.
Are you ready? Here it goes…
What does Prevalence Rate in Statistics Mean?
The prevalence rate is the total number of cases of a disease in a specific population divided by the total number of people in that population at a specific time (from: Dorland’s Medical Dictionary for Health Consumers (2007)).
The important piece of this definition is total number of cases. The total number of cases means that prevalence counts the newly diagnosed cases as well as people who have had the disease for a while.
Here is an example of how prevalence rate is determined:
Suppose, for example, that on April 20, 2013, in a town of 40,000 people, 1,200 people were newly diagnosed with cancer and 2,800 were living with cancer. The prevalence rate would be:
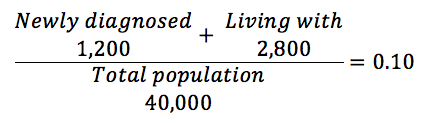
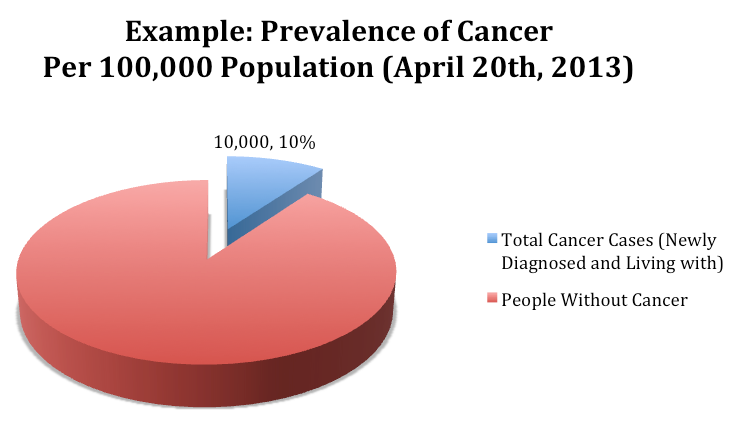
OKAY… we got a number but it really doesn’t mean anything to most people. What happens next? We would say that the prevalence rate in the population of 40,000 people on April 20, 2013 is 0.10. Or epidemiologists will project that the prevalence of cancer is 10,000 per 100,000. The way they get this figure is they multiply 100,000 x 0.10 figuring that people can understand 10,000 better than 0.10.
Here is a picture to show this proportion:
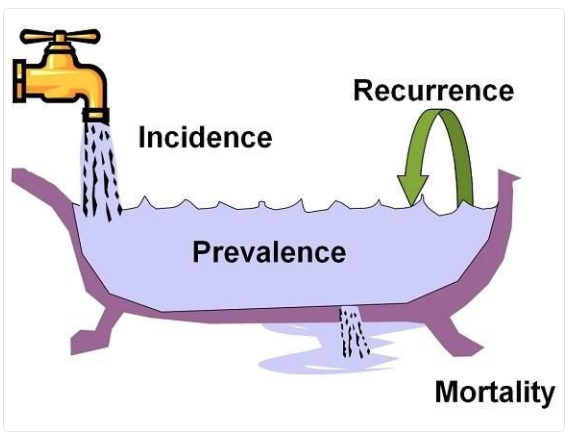
Here is a great graphic to help explain incidence, prevalence, mortality and recurrence:
What other medical or healthcare numbers are you hiding from? Tell us a number from statistics in the comments section and we’ll try to help.


Perfect explanation. Need to point out that you can’t make useful conclusions about risk from prevalence data. Say that the 10% of people with cancer in this example were all men. Because you counted people who had the condition BEFORE the prevalence count as well as at the time of the count, you can’t attribute gender as the cause of the cancer. This determination requires a prospective, incidence determination, as discussed in the last blog.
Prevalence rates are useful for estimating change in rates of the condition over time. If it was 10% this year, and 10 years ago it was 5%, then there is a signal that cancer rates are growing in this population.